You measure frequency response, look at the graph, think “the lows are bloated,” and that’s where it ends. The part that actually does something comes after the measurement: subtracting the room’s character. Sonir derives frequency response from a single smartphone sweep and goes on to build the room EQ prescription itself.
The short version
Record a sweep on a smartphone and you get the room’s frequency response. Overlay a target curve, take the difference, drop auto PEQ into the low end (roughly 20 to 300 Hz), and the room’s character cleans up a long way. Sonir exports that PEQ as REW / Equalizer APO, so the correction you measured feeds straight into playback. Two things you don’t miss: EQ only works cleanly in the lows, and you don’t boost dips; absolute accuracy needs a calibration file.
What frequency response actually shows
Frequency response (FR) is a single curve of how strongly each frequency comes back. It tells you at a glance which bands the room over- or under-emphasizes.
What Sonir produces is a relative curve, not an absolute level: the midrange (300 Hz to 3 kHz) is normalized to 0 dB and smoothed at 1/6 octave. So you read bumps per band, like “this room is +8 dB at 80 Hz.” Even if the whole curve shifts up or down because of mic unit-to-unit variation, the shape of the bumps survives, which is plenty for relative comparison. An absolute “so many dB SPL” can’t come out of a built-in mic alone. You accept that and move on.
Don’t stop at measuring: the target difference
Measure FR and just stare at it, and you’re barely past an SPL meter. The heart of room EQ is taking the difference between the measured FR and a target curve you want, then filling that gap with filters.
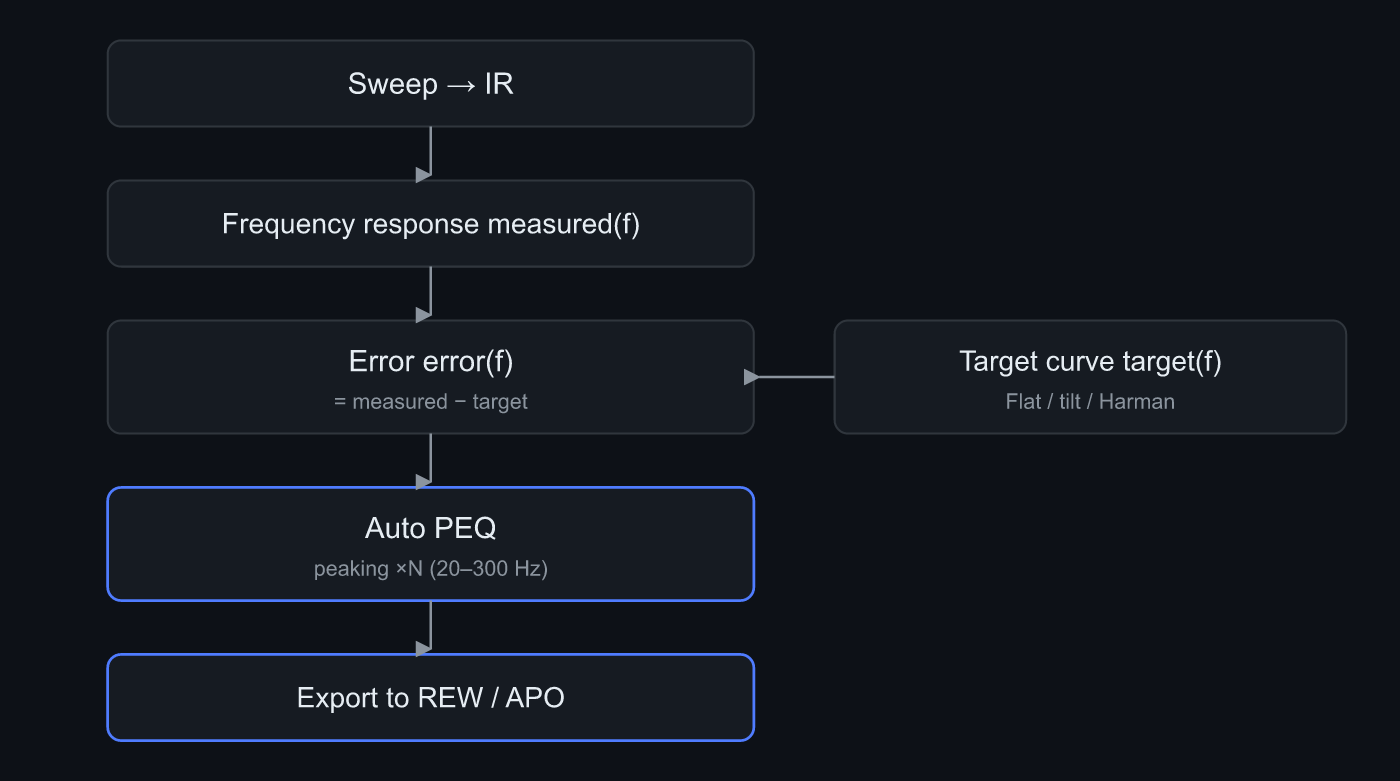 Subtract target(f) from measured(f) to get error(f), drop auto PEQ into the low end, and export to REW / APO
The flow goes like this. Subtract target(f) from the measured curve to get error(f). That error is a map of how far the room strays from the target. From there you just smooth the map’s peaks and dips with EQ.
There isn’t one target. You pick by use.
| Preset | Shape | Who it’s for |
|---|---|---|
| Flat | Flat across the band | Measurement-minded, nearfield monitors |
| Tilt | Gentle downward slope (adjustable) | General listening, keeps the highs from getting harsh |
| Harman | Slight low-end lift, gentle high rolloff | People who know the standard curve |
| B&K | Low-end boost + gradual high decay | Classical / acoustic leaning |
Flat and tilt apply cleanly. Harman and B&K are approximated with a low-shelf plus a slope, and whichever you pick, the part that builds the difference “how far off from 0 dB midrange” is the same. Starting with Flat or a gentle tilt makes it easy to see how much the low end is misbehaving.
EQ only works cleanly in the low end
This is the most misunderstood point. Try to flatten a room’s FR across the whole band and you usually make it worse.
Two reasons. One, the bumps in the mid and high range are comb filtering whose shape changes when you move the listening position a few centimeters; shave a specific peak and it backfires at another spot. Two, most dips are room cancellation, standing-wave nulls, where boosting with EQ doesn’t bring energy back and just eats headroom.
That’s why Sonir’s auto PEQ confines the EQ band to 20 to 300 Hz by default. That’s below the Schroeder frequency (the boundary where a room shifts from modal to diffuse, roughly 250 to 300 Hz), the low end where room modes rule. EQ works cleanly here. A slider moves the ceiling within 80 to 500 Hz. The mid and high range stays a gentle tilt toward the target, with no shaving of peaks one at a time.
And cut takes priority over boost. Cutting an over-emphasized peak is safer than filling a dip, and it protects headroom. The defaults are asymmetric: boost up to +6 dB, cut up to -12 dB. That cut-leaning design is what keeps chasing flat from breaking the sound.
How auto PEQ gets built
Once the difference is out, all that’s left is placing PEQ that cancels it. Doing that by hand one filter at a time is tedious, so Sonir places them automatically with a greedy method (matching pursuit).
What it does is simple. Find the frequency where the absolute error is largest, estimate Q from the -3 dB width of that peak or dip, drop in one peaking filter, and subtract its response from the difference. Repeat until the residual is small enough, or up to the band limit (10 filters max by default). Finally it computes a negative preamp automatically so the boosts don’t clip.
The generated filter list (a run like PK 42Hz Q1.4 -6.0dB), the preamp, and the predicted post-correction curve all show on screen for free in Sonir. It shows you the prescription. What you pay for is export, taking it outside.
Auto PEQ does assume calibration, though. Mistaking the mic’s coloring for the room and EQ’ing it away backfires, so Sonir won’t generate auto PEQ unless a calibration file is loaded. You can see the visualization (measured vs target) without calibration, but if you’re seriously applying correction, have one calibration file (.txt) ready.
Exporting to REW / APO
A PEQ that stays inside Sonir doesn’t mean much. The room changes only once it’s applied on playback.
It exports as REW Filter Settings and Equalizer APO config.txt. A Preamp: -3.0 dB followed by lines like Filter 1: ON PK Fc 42 Hz Gain -6.0 dB Q 1.40 — the standard text. Read it into REW to refine, or apply it directly to PC playback through APO. Direct export to WiiM or Roon is on hold pending format confirmation. You can also export the measured FR itself as CSV, which leaves an escape hatch into your own design.
Common mistakes
In rough order of how easily you hit them.
The most common is boosting a dip. A deep dip in the FR tempts you to fill it, but as said, a null doesn’t come back with EQ; the more you boost, the more headroom you lose until it distorts. Next is trusting the shape without calibration. An uncalibrated built-in mic’s curve mixes the room’s character with the mic’s, and while that’s fine for reading trends, absolute-accurate correction needs a calibration file.
A quiet one is single-point measurement. Measure at just one spot at the listening position and you catch a dip that happens to land there, boost it hard, and it falls apart when you move your head a little. The right move is to measure at slightly different positions and EQ against a power-averaged FR.
An aside: rather than waiting for late-night quiet, running a longer sweep at midday is often more stable. Earn SNR from time, not volume — same as it is for FR.
Summary
- Frequency response is a relative curve; you read bumps against a 0 dB midrange. A single smartphone sweep gets it
- The heart of room EQ is the difference between measured FR and the target. You fill the error
- EQ works cleanly in the lows (roughly 20 to 300 Hz). No shaving mid/high peaks, no boosting dips
- Auto PEQ places peaking with a greedy method, cut-first, with an automatic negative preamp. Calibration is assumed
- Export as REW / Equalizer APO and feed playback. Sonir is free through the preview; taking it out is Pro
FAQ
Can I apply room EQ without a calibration mic?
For spotting trends, the built-in mic shows the shape. But Sonir’s auto PEQ requires calibration and won’t generate without a calibration file (.txt) loaded, because correcting the mic’s own coloring as if it were the room backfires.
Which band should I fix first with room EQ?
The low end. Roughly 20 to 300 Hz, below the Schroeder frequency where room modes dominate. The mid and high range changes shape with listening position, so it doesn’t get pinpoint correction.
Should I boost a dip in the frequency response with EQ?
As a rule, no. Most deep dips are standing-wave nulls; boosting them doesn’t bring the energy back and just eats headroom until it distorts. Cutting the peaks comes first.
What formats can Sonir export PEQ to?
REW Filter Settings and Equalizer APO config.txt. It writes the preamp line and the peaking filter list so you can feed it into playback. You can also export the measured FR itself as CSV.
Should the mid and high range be EQ’d too?
As a rule, no. Mid and high bumps are position-dependent comb filtering; shaving peaks one by one backfires at another position. A gentle tilt toward the target is the right call for serious listeners.
Related articles
- Measuring room acoustics with a smartphone: where frequency response sits among the three axes of time, frequency, and their combination
- Can a smartphone replace REW?: how far phone-only measurement reaches against desktop REW, and where it stops
- Feature details: from sweep → IR through frequency response, room EQ, and export
Measure it in Sonir
Sonir is an app that completes acoustic measurement and comparison on your smartphone. The frequency response measurement and room EQ in this guide too — just play the sweep and record, and it derives FR from the IR and designs the low-end PEQ automatically. Free from measurement through the PEQ preview; export to REW / APO and per-band deep dives are Pro.
iOS / Android, coming soon. See the features page.