
A waterfall plot looks three-dimensional, but there is only one thing to read in it: whether some band decays later than the rest.
The short answer
Frequency runs across, time runs down, height and colour are level. If every band sinks together, the room is fine. If one ridge trails behind, that frequency is resonating. Match it against the peaks in your frequency response and you have the input for an absorption-or-EQ decision.
What is actually being stacked
Take the impulse response, cut it at successive instants, FFT everything from that instant onward, and stack the results along time. That is a waterfall, or CSD (cumulative spectral decay).
It gets confused with a spectrogram because they look alike, but the window differs. A spectrogram answers “what was sounding right then.” A waterfall answers “what is still left from then on.” Which is why a spectrogram is the right tool for a music file, and a waterfall is the right tool for a room.
Sonir stacks a 1024-point FFT every 256 samples, about 5.3 ms apart at 48 kHz. The frequency axis takes 64 log-spaced points from 50 Hz to 16 kHz. Colour spans 0 to -60 dB relative to the peak. The time axis puts the direct sound at 0 ms and is trimmed to roughly 1.2 times RT60.
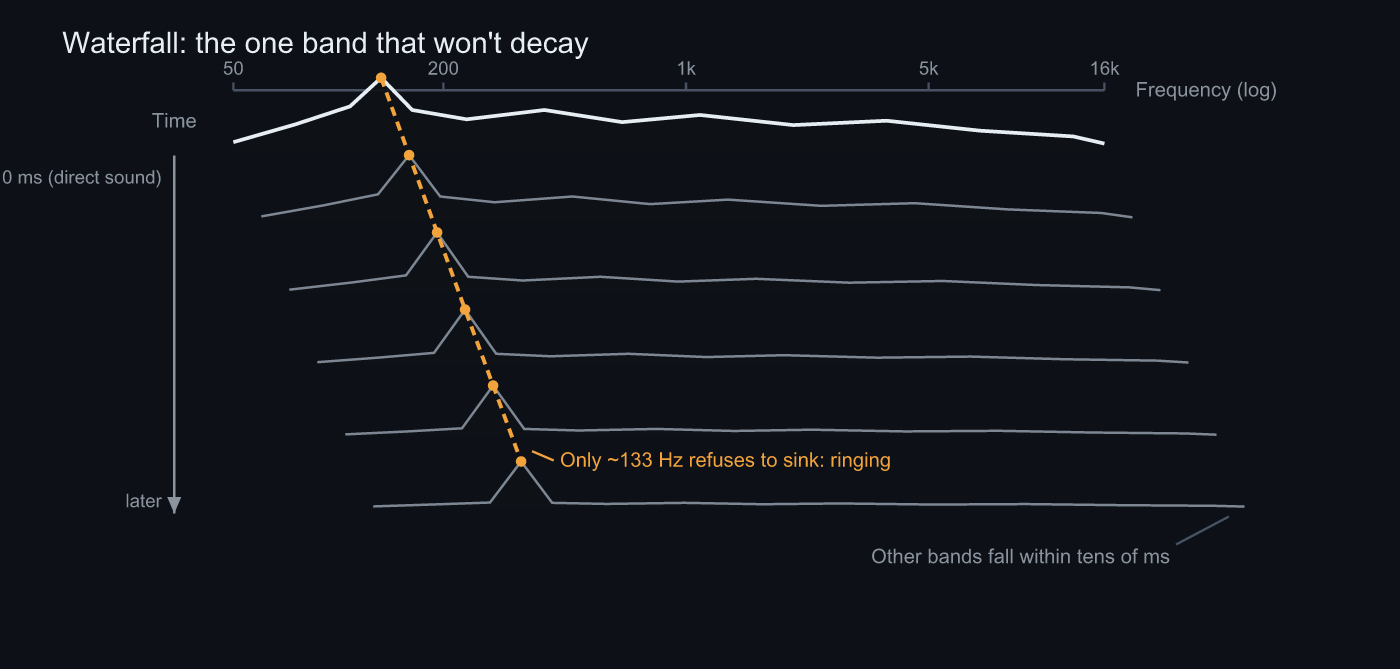 Direct sound at the top, later times further down. Everything else falls within tens of milliseconds while ~133 Hz keeps hanging on
Read it vertically
Reading a waterfall horizontally, as a frequency response, is a way to get nothing out of it. That’s the frequency response graph’s job. What the waterfall shows is the vertical direction: how fast a given frequency drops as time passes.
An even decay means there is nothing to read. The common finding is one or two bass ridges lagging behind, which is a room mode. The next most common is a thin, persistent tail somewhere around 5 to 8 kHz, and that one points less at the room than at a hard nearby surface or the speaker itself.
The bass is where resolution runs out
This is the part that gets misread most. A 1024-point FFT at 48 kHz gives about 46.9 Hz per bin and a window about 21.3 ms long. A mode at 80 Hz and a mode at 120 Hz sit one bin apart, so the waterfall cannot separate them. Two resonances show up as one broad tail.
Lengthen the window and frequency resolution improves, but time resolution goes with it and “when it decayed” blurs. Shorten it and you can track time while the bass smears. That trade is structural to CSD as a display, not something a setting fixes. REW and the desktop tools live with exactly the same constraint.
So a bass waterfall is not an instrument for counting modes. Its job ends at “something around here is slow.” From there the work moves to the peak positions in the frequency response, and if you need numbers, to per-band RT60. Per-band RT60 in Sonir is free too, and getting the initial bearing takes only the broadband measurement.
Incidentally, waterfalls photograph well, which is why they end up first in every posted screenshot of a measurement. What actually changes a decision, most days, is the frequency response and the per-band RT60 figures.
FAQ
How is a waterfall different from a spectrogram?
The window they take. A spectrogram lines up what was sounding at each instant; a waterfall lines up the energy still remaining from each instant onward. The first is for looking inside a source, the second for judging how fast each band decays.
How many seconds does the waterfall show?
It varies per measurement. Sonir trims the time axis to roughly 1.2 times RT60, and estimates from EDT when RT60 isn’t available. A dry room gets a shorter window automatically, so the length is not comparable between measurements.
Why does bass ringing look so wide?
That is the resolution limit. A 1024-point FFT at 48 kHz gives roughly 46.9 Hz per bin. Below 100 Hz, adjacent modes land in the same bin, so several resonances appear as one broad tail. Don’t use it to count modes.
Is the waterfall free?
No, it’s free. The IR from a sweep, RT60, EDT, C50, D50, the waterfall, ETC and the frequency response are all free. Per-band analysis in octave and third-octave steps, and band-limited sweeps, are free as well.
The whole plot is flat and one colour. What now?
Either the recording clipped or the SNR is too low. Clipping flattens the decay slope, which makes every band look equally fast. Get the recording peak between -6 and -12 dBFS first, and if it’s still unreadable, use a longer sweep to buy SNR.
Related reading
- Measuring room acoustics with a smartphone: the parent guide, from sweep to IR and everything derived from it
- Why is my RT60 absurdly long?: clipping and SNR, the same root cause behind a flat waterfall
- Which band should room EQ fix first?: what to do once you’ve found the bass ridge
- EDT, C50 and C80: how they differ from RT60: picking the right metric when you want the decay as a number
Measure it with Sonir
Sonir does acoustic measurement and comparison entirely on your phone. The waterfall in this article is drawn from the IR automatically: play a sweep, record it, done. Everything is free, including per-octave analysis.
Download on the App Store. Android coming soon. More on the features page.