
You buy a new speaker, measure it with your phone, and there is a +9 dB mountain sitting at 100 Hz. The datasheet says ±3 dB. Is the speaker broken, or is the datasheet lying? Neither. You measured a different thing.
The short answer
One sweep from your phone will give you a speaker’s frequency response. But the curve you get is not the speaker on its own. It is speaker plus room plus microphone. It will never match an anechoic datasheet, and that is not a measurement error. Once you accept that, phone measurement becomes genuinely useful. What works is differences, not absolutes: before versus after, left versus right, gear A versus gear B. Read it with a weighting in mind: the lower you go the more it is the room, the higher you go the more it is the speaker.
What you can and cannot measure
Start with the boundary.
| You can measure | You cannot measure |
|---|---|
| The shape of the response (relative curve) | An anechoic, speaker-only response |
| The change after moving or swapping gear | Absolute SPL without calibration |
| Left/right response and arrival time difference | Bass with the room fully removed |
| How the room’s decay (RT60) relates to it | Headphones and IEMs (Sonir does not support them) |
The first line on the right is basically this whole article. A manufacturer’s curve comes from an anechoic chamber or something close to it. Your room has a floor, walls and a ceiling, and the sound that leaves the speaker bounces off all of them before it reaches the microphone. The same speaker measures differently in a different room. That is not a flaw in the measurement. It is what you are actually listening to.
Why the curve is always speaker plus room
Sound arriving at the microphone splits into three parts. The direct sound that travelled straight from the driver, the early reflections that bounce once or twice off a surface and arrive a few milliseconds later, and the reverb tail that keeps bouncing around the room while it decays. Frequency response is the sum of all three.
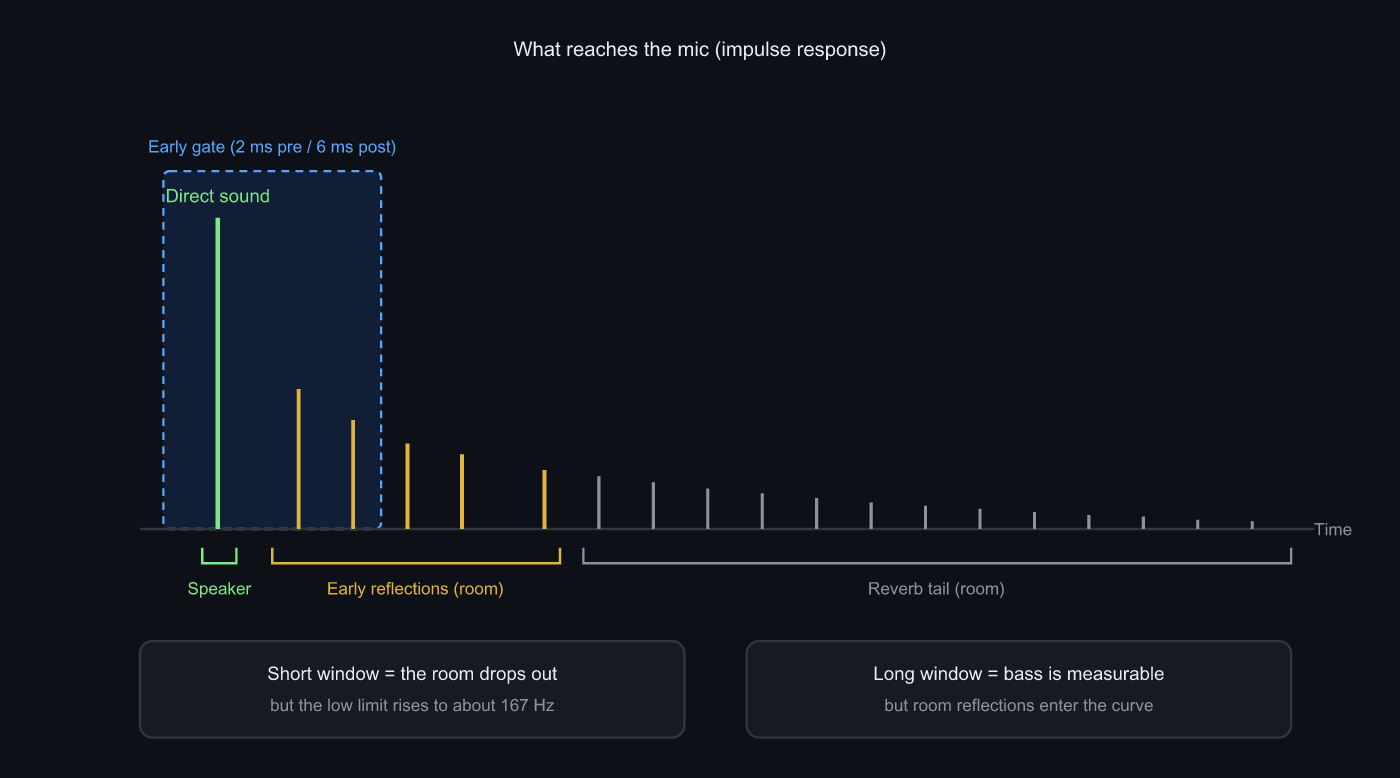 Direct sound, early reflections, reverb tail. A shorter window rejects more of the room, but raises the lowest frequency you can still measure
If you could isolate the direct sound, you would have something close to the speaker itself. And you can, up to a point: cut the head off the impulse response in the time domain and the reflections go with it. This is the classic quasi-anechoic trick, and Sonir uses it internally. Imaging analysis gates to 2 ms before and 6 ms after the direct peak before comparing left and right; group delay analysis gates to 2 ms before and 16 ms after, to keep reverberant comb filtering from wrecking the phase.
The catch is that the trick does not work at low frequencies. Cut the window to 6 ms and your frequency resolution drops to roughly 1 ÷ 0.006 s = 167 Hz. Below that, not even one cycle fits inside the window, so there is nothing to measure. Rejecting low-frequency reflections needs a long window, and a long window lets the reflections back in. This contradiction is physical, not a matter of implementation. Desktop REW hits exactly the same wall unless you own an anechoic chamber.
So Sonir does not gate the frequency response it shows you. Gating would delete the bass. What you see comes from the full impulse response (about 0.6 seconds of tail by default), room included. Saying “room included” out loud seems more honest than handing you a half-gated curve and calling it the speaker’s response.
The rough boundary is the Schroeder frequency, where a room stops being a set of discrete modes and starts behaving diffusely. In a normal listening room that lands somewhere near 250 to 300 Hz. As a rule of thumb: below it you are looking at the room, above it at the speaker. When you see a huge peak or dip in the bass, suspect the room first.
Three ways to weight the measurement toward the gear
You cannot delete the room, so reduce its share instead. Three things actually work.
Move closer. Direct sound falls off with the square of distance, while the reverberant field is roughly the same strength anywhere in the room. So the closer you get, the higher the direct ratio. At 30 to 50 cm the midrange and treble start looking a lot like the gear. Get too close, though, and the differing distances to woofer and tweeter start to matter, giving you ripples around the crossover that never occur at the listening seat. Measure at the seat if the question is “how does this sound in my room”, up close if it is “what does this unit do”.
Measure several positions. A single point will make you read a deep dip as a defect in the speaker, when moving your head 10 cm makes it disappear. Take three measurements a few tens of centimetres apart. Features common to all three belong to the speaker; features that move belong to the room.
Compare under identical conditions. Measure gear A and gear B from the same spot, at the same distance, at the same playback level, and take the difference. The room contributes to both, so it largely cancels. That is why a difference curve deserves more trust than any single absolute curve. Sonir’s comparison mode overlays two measurements and puts the A−B difference in the foreground, and it warns you when calibration state or conditions do not match between them. It warns rather than blocks, because sometimes you know exactly what you are doing.
The measurement itself
The actual flow:
- Pick a distance. On the front axis, at 30 to 50 cm or at the listening seat. Note down which
- Set the level. Adjust playback so the peak lands between -6 and -12 dBFS. Clipping flattens peaks and stretches decay. It is the single most common way a measurement gets ruined
- Play the sweep. A 20 Hz to 20 kHz rising sweep, recorded at the same time. Lengths of 5, 10 and 20 seconds are available. Pick the longer one when the air conditioning or the street is audible: SNR comes from time, not volume
- Read the curve. Relative, 300 Hz to 3 kHz normalized to 0 dB, smoothed at 1/6 octave. Look at where the bumps are and how big they are
- Change one thing and repeat. Distance or mic position, not both. Overlay them: what moved is the room, what stayed is the speaker
Sweep measurement through RT60, waterfall and frequency response is free. Per-band analysis in octave and third-octave bands, and overlaying measurements against each other, are free too.
Measuring left and right separately
If you listen in stereo, knowing one side tells you half the story. When the two differ, the image pulls to one side and everything blurs.
Sonir’s imaging measurement drives the two speakers with the same rising sweep, separated in time rather than simultaneously. A design using simultaneous up and down sweeps was considered and dropped: different inverse filters for left and right make the processing asymmetric, and that asymmetry ends up in the shapes. Driving them in sequence puts both sides through identical processing, and crosstalk is zero by construction.
Out of it you get the arrival time difference in microseconds, the cross-correlation between the left and right impulse responses (0 to 1, where closer to 1 means the two sides respond more alike), and the difference per band. When something shows up here, the cause is usually placement rather than unit variation: one side closer to a wall, a bookshelf in front of one speaker, toe-in that drifted. Treat a left/right measurement as an inspection of your room layout more than of your speakers.
Common mistakes
Roughly in order of frequency.
Expecting the datasheet number. You will not get it. You are comparing an anechoic chamber with a room. Compare your own measurements against each other instead.
Blaming the speaker for a bass dip. A -15 dB hole at 80 Hz is almost always a standing wave null. Move the mic; if the hole moves, it was the room.
Not noticing clipping. When the recording slams into the ceiling, the treble peaks flatten and the curve can look suspiciously smooth. “Flatter than I expected” followed by a clipped recording is the nastiest version of this.
Trusting absolute values without calibration. A phone’s built-in mic has its own character, particularly at the top and the very bottom. In a relative comparison that character sits on both curves and cancels. If you plan to treat a single curve as truth, you need a calibration file.
By the way, if your numbers drift between runs, check the playback side before anything else. I once spent half a day on this only to find that a streaming app’s loudness normalization was applying its own gain to my test sweep, track by track.
Summary
- A phone measures speaker plus room plus microphone, never the speaker alone
- Time-gating buys quasi-anechoic data, but a 6 ms window puts the floor at roughly 167 Hz, so it fails in the bass
- Below roughly 250 to 300 Hz (the Schroeder frequency) read it as room, above it as speaker
- To lean toward the gear: move closer, measure several positions, take differences under identical conditions
- Left and right can be measured separately. When they differ, suspect asymmetric placement before unit variation
Frequently asked questions
Can a phone measure speaker frequency response accurately?
It measures the shape reliably, but that shape is not the speaker alone. It is speaker plus room plus microphone. That is enough for relative work: before and after, left versus right, gear A versus gear B. An anechoic datasheet curve cannot be reproduced in a room by any app, phone or otherwise.
Is what I measured the speaker or the room?
The lower the frequency, the more it is the room. The rough boundary is the Schroeder frequency, around 250 to 300 Hz in a normal room, below which standing waves dominate. To separate them, measure close to the speaker and compare that curve against the one taken further away.
If I measure up close, do I get the speaker on its own?
Closer means a higher ratio of direct sound, so the curve leans toward the gear, but it never becomes the speaker alone. Too close and the distance between drivers starts to matter, producing ripples around the crossover that never happen at the listening seat. Start around 30 to 50 cm and read it alongside a listening-position measurement.
Can I measure the left and right speaker separately?
Yes. Sonir’s imaging measurement drives left and right with the same rising sweep, one after the other, and derives the arrival time difference in microseconds, the cross-correlation between the two impulse responses, and the per-band left/right difference. Asymmetric placement, such as one speaker sitting closer to a wall, shows up here.
Can I get absolute sound pressure in dB SPL?
Not from a phone’s built-in microphone alone. The frequency response is a relative curve with 300 Hz to 3 kHz set to 0 dB. If you need absolute values, use a calibrated microphone and load its calibration file (.txt). For relative comparison, calibration is optional.
Related reading
- Measuring Frequency Response and Applying Room EQ from a Phone: subtracting the room’s character from the curve you measured
- How to Compare Speakers A/B Fairly: the three things to keep identical when comparing two units
- What Are Standing Waves, and Why Does Bass Misbehave?: where those huge bass peaks and dips come from
- Can You Trust Frequency Response Without a Calibrated Mic?: what calibration actually changes
Measure it with Sonir
Sonir does acoustic measurement and comparison entirely on your phone. Speaker measurement works the way this article describes: play a sweep, record it, and the impulse response gives you the frequency response, down to the difference between your left and right channels. Everything is free, including per-band analysis and overlaying measurements.
Download on the App Store. Android is coming soon. See the features page for details.